
How to read the “Bugs” dashboard in the back office
Who can view the “Bugs” dashboard?
Devs and Admins can see the “Bugs” dashboard, which provides quick feature insights.
Where can I find the “Bugs” dashboard?
The “Bugs” dashboard can be found in the back office for any Universe that has the “Bugs” feature activated.
Locate the “Bugs” feature for the desired Universe. You will land on the “Bugs” dashboard.
If you are unable to see the dashboard from the “Bugs” feature page, click the “Dashboard” tab at the bottom of the header.
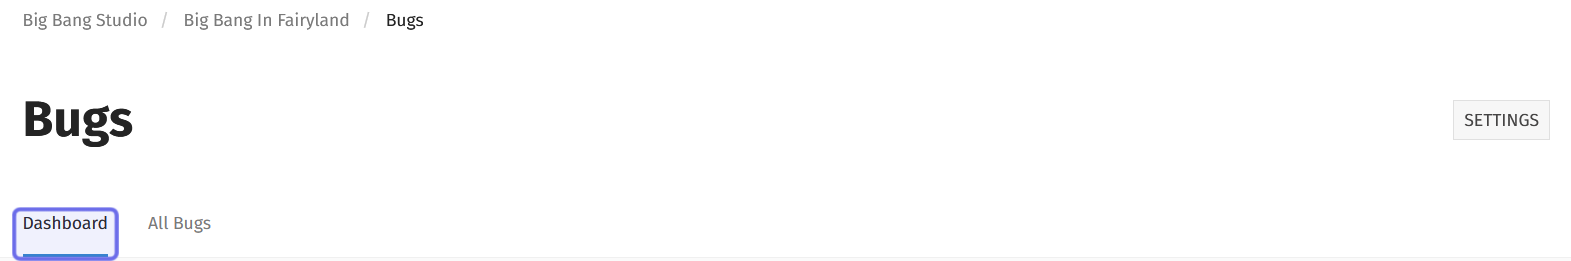
At the bottom of the “Bugs” header, there are two tabs. Make sure you are in the “Dashboard” tab to view the “Bugs” dashboard.
What can I find on the “Bugs” dashboard?
In the “Bugs” dashboard, you can find a series of blocks that summarize data from the “Bugs” feature.
Across the top of the dashboard is a row that provides a quick overview of the “Bugs” feature overall and over the past seven days.
The row consists of five boxes, each divided by a horizontal line. Above the line shows the overall total of the statistic (e.g., “32 submitted”). Below the line shows the change over the past seven days (e.g. “+7 this week”).
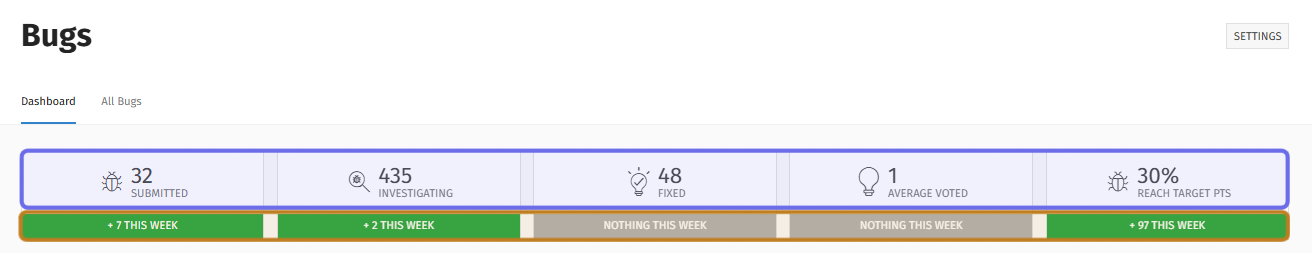
There are five boxes in a row at the top of the “Bugs” dashboard. The overall numbers are shown highlighted in purple above. The changes over the past seven days are shown highlighted in yellow.
Reading from left to right, this row displays:
the number of bugs submitted overall and over the previous seven days,
the number of bugs whose status is currently “Investigating” and whose status was updated to “Investigating” over the past seven days,
the number of bugs whose status is “Fixed” and was whose status was updated to “Fixed” in the past week,
the average number of votes across all published bug reports, along with the difference between the overall average and the average over the past seven days if there was a change,
the percentage of all published bug reports that have met or exceeded the upvote threshold, along with the number of bugs that met that threshold over the past seven days.
Note: If you rename one of the displayed statuses, names on the blocks will be updated to reflect the change.
Below the top row are the following blocks:
“Bugs Insight” graph
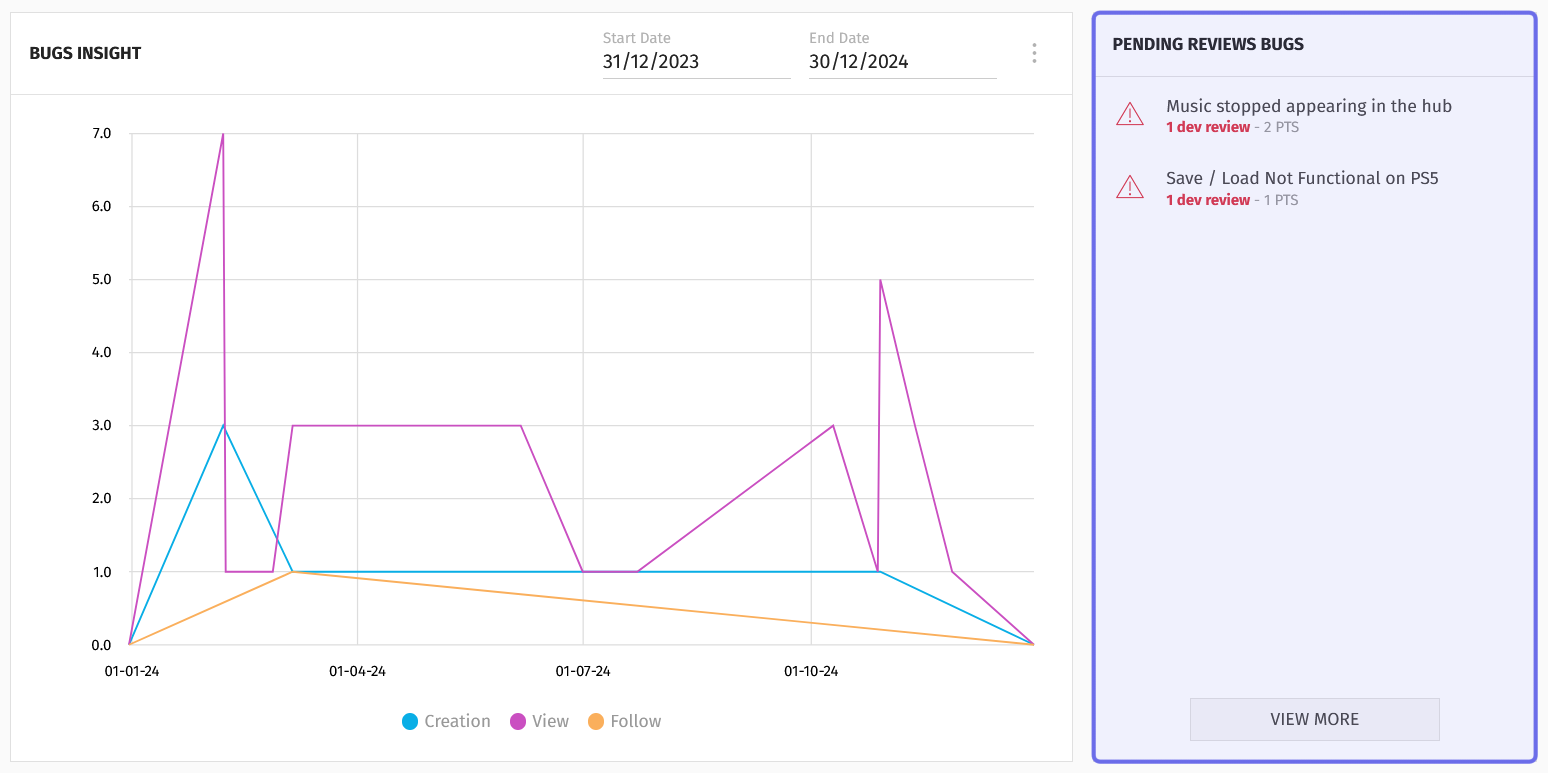
The “Bugs” insight graph is beneath the top row summary on the left-hand side. It provides a quick, visual way to show trends in how users are interacting with the “Bugs” feature.
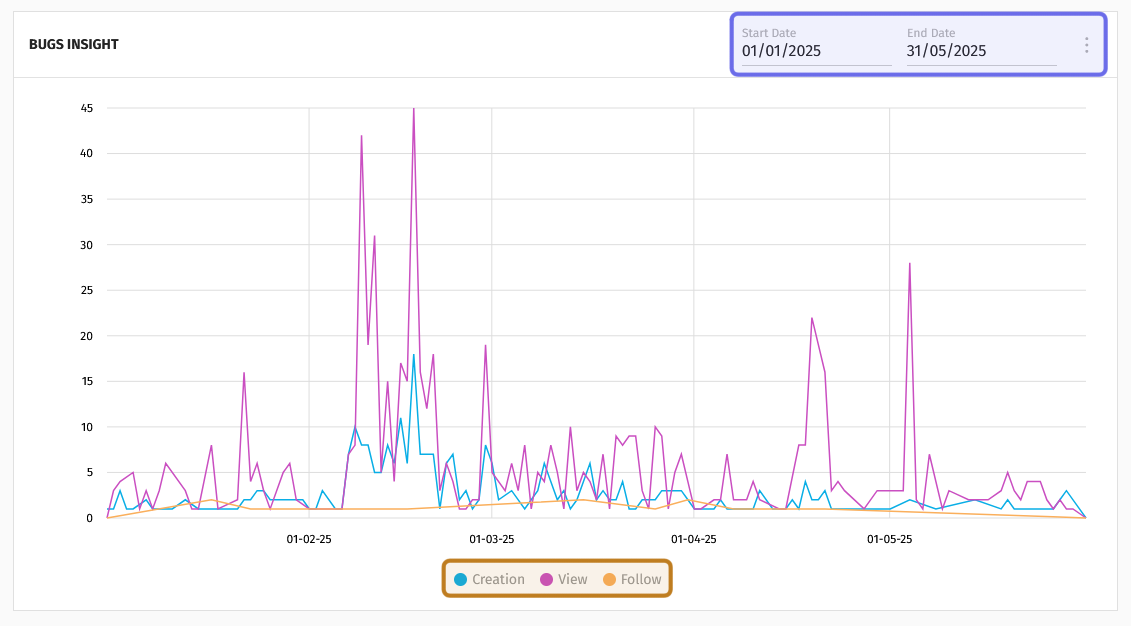
A “Bugs Insight” graph is shown above. The date fields where you can change the period of time the graph captures and the three dots button which lets you download the data are highlighted in purple. The graph key, showing which data is tracked, is highlighted in yellow.
The multiple line graph tracks three pieces of data over a specified period of time:
“Creation” tracks the number of bug reports submitted by users.
“View” tracks the number of instances where users have viewed any bug report.
“Follow” tracks the number of times users have followed any bug report.
The graph’s time frame can be changed by using the “Start Date” and “End Date” date pickers above the graph. Click a date field to select a new date.
To the right of the “End Date” field are three dots arranged vertically. Clicking this button will open a menu with two options: “Export” and “Filter.”
“Export” allows you to download a .csv of the data points used to build the “Bugs Insight” block that is currently displayed.
“Filter” allows you to search for a specific bug. Enter a keyword or phrase from a bug’s title in the field. Matching bug reports will drop down. If you click on one of the bug reports that drop down, the graph will only display data for that bug report.
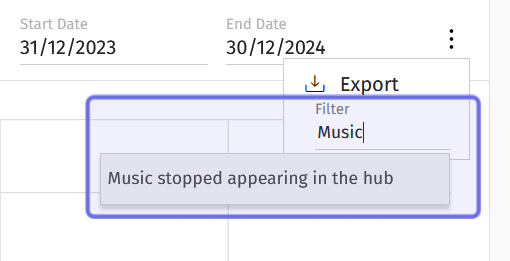
The three dots menu is shown above. A search in the “Filter” field is highlighted in purple. The keyword entered in the “Filter” field has been successfully matched to a bug report.
Note: You cannot stack filters to show data for a subset of bug reports.
“Pending Reviews Bugs”
To the right of the “Bugs Insight” graph is a box showing all bug reports with the “Investigating” status. For each bug, the title, number of dev reviews, and number of votes that bug report has received are shown.
Click on a bug to be taken to the bug report’s individual page in the back office.
Shown above is the “Bugs” dashboard row that sits below the summarizing row made up of small blocks. The “Pending Reviews Bugs” is highlighted in purple. It is located next to the “Bugs Insight” graph on the right.
You can click “View More” at the bottom of the block to see a list of all bugs filtered for the “Investigating” status.
“Latest Bugs”
In the bottom left of the dashboard is the “Latest Bugs” block. This block lists the most recent submitted bug reports. For each bug, the title, the user who submitted the bug, and the date the bug report was created are shown.
You can click on a bug to be taken to the bug report’s individual page in the back office.
Click the “View More” to be taken to the “All Bugs” tab where you can add more filters and sort the list.
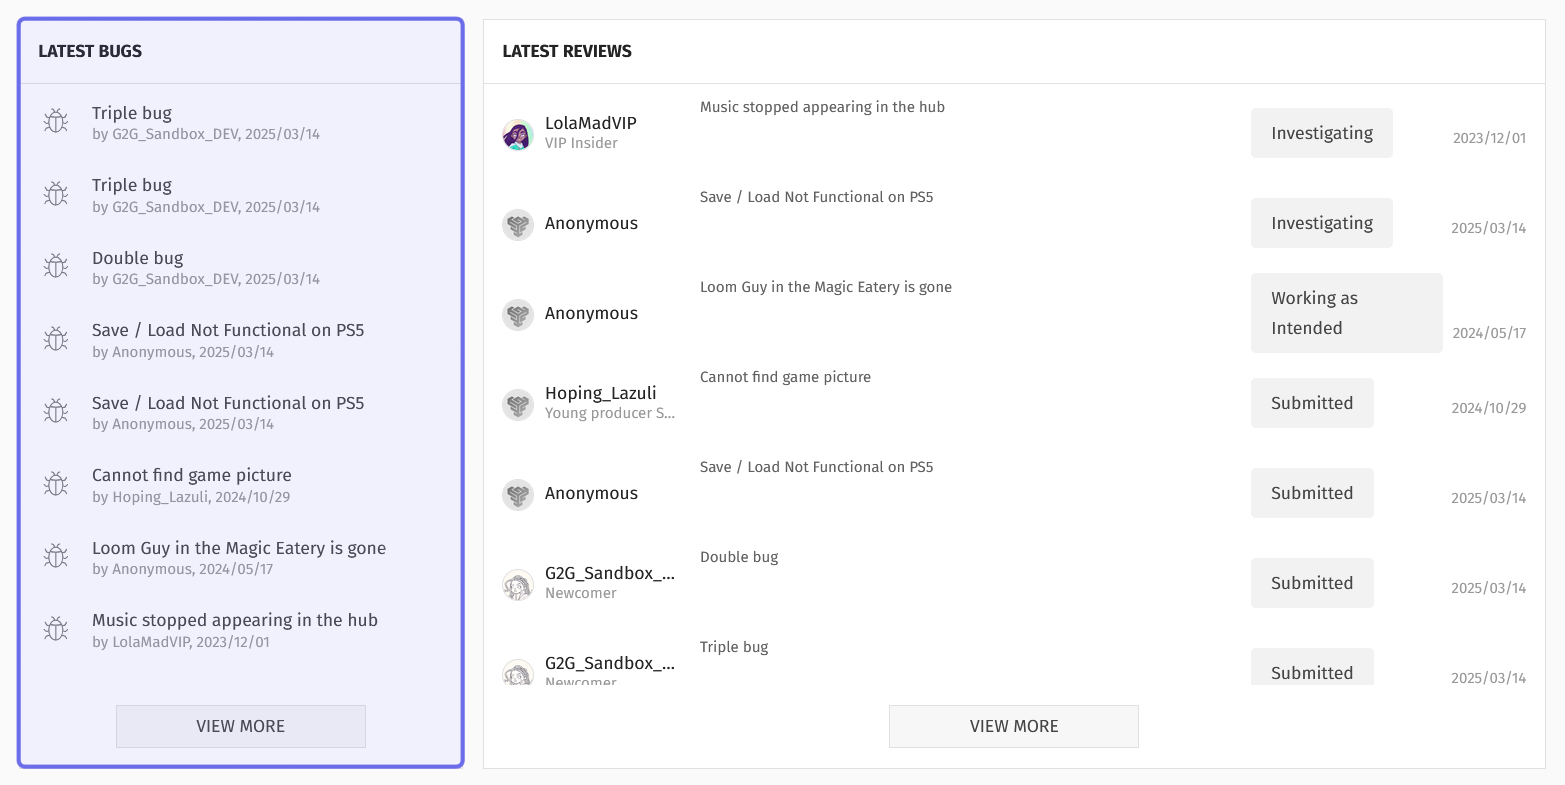
The bottom of the “Bugs” dashboard is shown above. The “Latest Bugs” block is on the left-hand side of the bottom row. It is highlighted in purple.
“Latest Reviews”
The “Latest Reviews” block is in the bottom right of the “Bugs” dashboard. It displays the bugs that have most recently been reviewed by Devs. Each bug has the following information displayed horizontally: the user who submitted the bug, the bug report’s title, the bug’s status, and the date the bug report was created.
Click on a bug to be taken to the bug report’s page in the back office.
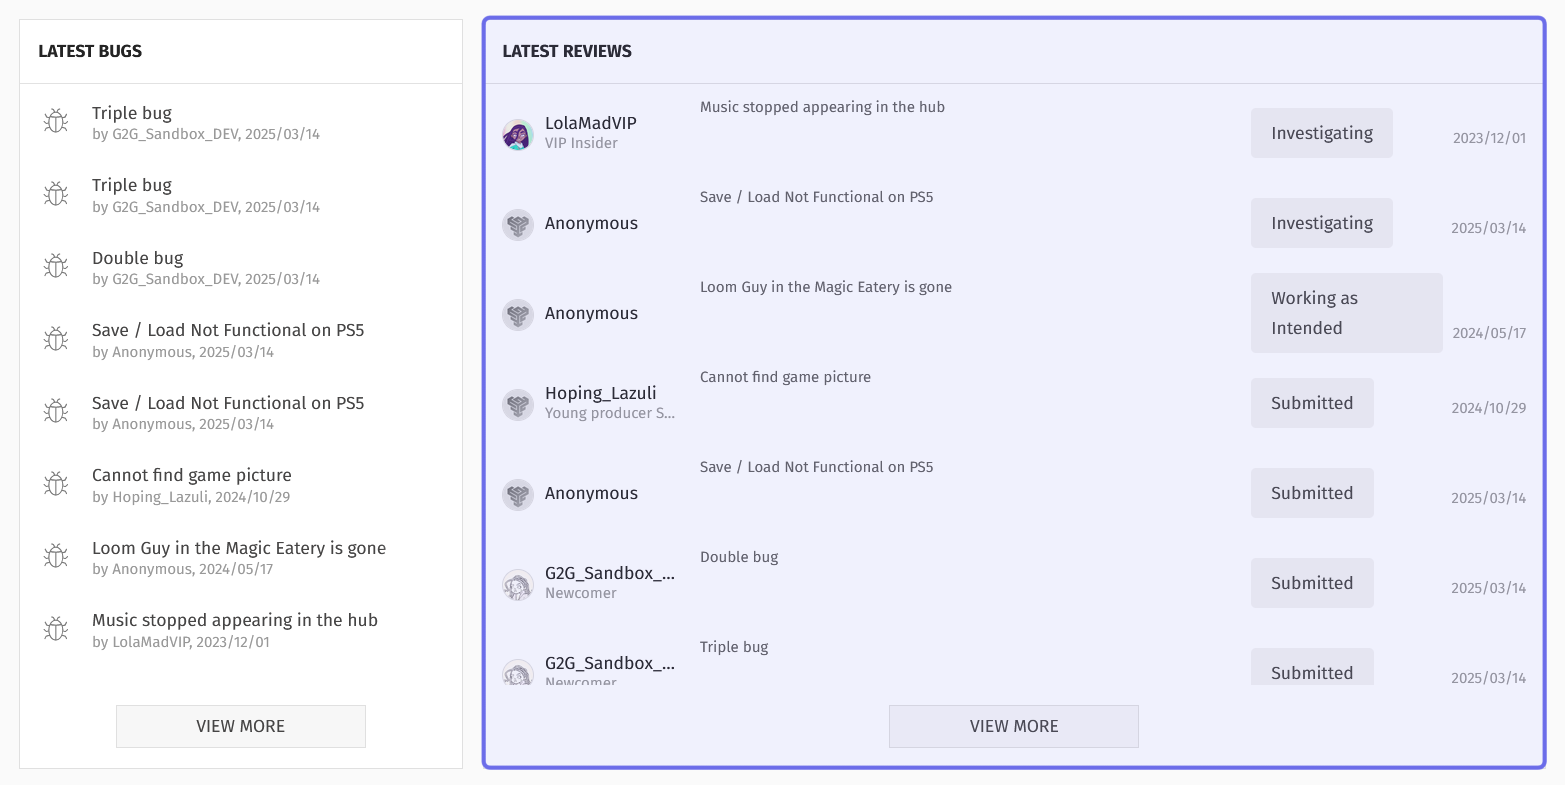
The bottom row of the “Bugs” dashboard is shown above. The “Latest Reviews” block is on the right, highlighted here in purple.
Click “View More” to see these bug reports under the “All Bugs” tab, which will allow you to sort the list.
Note: You can easily navigate back to the “Bugs” dashboard from an individual bug report’s page by clicking the arrow on the right-hand side of the page header.
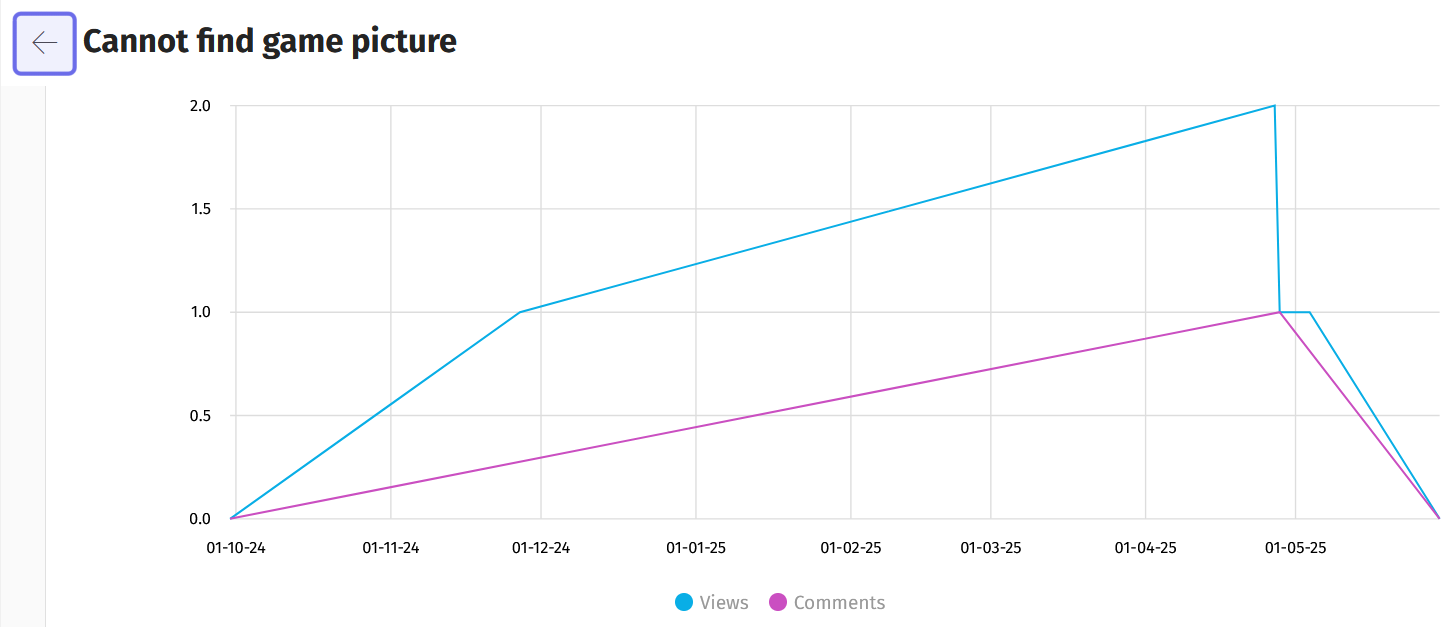
Part of an individual bug report’s back office page is shown here. The arrow to navigate back to the “Bugs” dashboard is highlighted in purple.